In this series of articles, I will try to explain what machine learning is, why we need it, and how it can be used in marketing. Are you interested in the application of machine learning in marketing? Then this is meant for you. Some programming, math, and statistics knowledge would be helpful but not necessary.
In order to understand what machine learning is and how it works, we should first know why we need it. Early computer programs were created and used mostly by physicists and mathematicians to perform repetitive procedures. That was because the machine could perform the same thing again and again with speed and precision. The machine could only do what it was programmed for though. This type of programs still exists, and the majority of the programs we use today are capable of performing a specific series of operations.
However, there are problems for which conventional computer programs are not suitable in a timely or feasible way. Take classification as an example. Classification is about putting things into buckets (classes or categories) based on their properties (features). Let’s say we want to write a program that can categorize fish into five different buckets. For this, we must first decide which properties we want to categorize our fish based on.
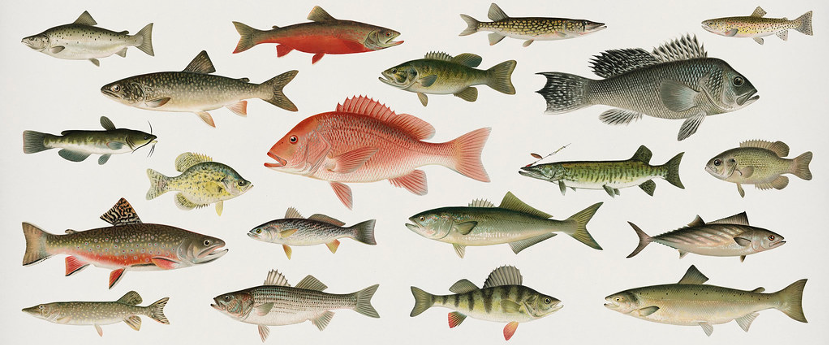
 (Figure 1 - Different types of fish)
As shown in Figure 1, fish can be categorized based on their color, body shape, number of fins etc. Properties such as length and weight are not considered proper features, since they change as the fish grow. Features like number of eyes, on the other hand, are not decisive enough considering that most of the fish types share the same value (two) and therefore, we cannot classify a fish into any of the buckets based on number of eyes. The body shape feature is somehow subjective too, so we can transform it into height-length ratio and call it body ratio. Skin color can be transformed into its corresponding hex value too (or even a series of hex values in case the fish are colorful), but for this example we go with the names. Usually, raw data must be pre-processed in order to be used in a model.
In machine learning, the process of selecting a subset of properties in order to make a model is called feature selection.
Now, assume we decide to categorize the fish into five buckets, e.g. A to E, based on the following features:
Each of the features above can take any of the values listed in Table 1.
| Interval 1 | Interval 2 | Interval 3 | Interval 4 | Interval 5 | |
| Body ratio | 1 - 0.5 | 0.5 - 0.33 | 0.33 - 0.25 | 0.25 - 0.20 | 0.20 - 0.16 |
| Number of fins | 3 | 4 | 5 | 6 | 7 |
| Color | Red | Blue | Green | Yellow | Brown |
(Table 1 - Features and their value intervals)
Note that features do not have to have the same number of intervals.
Once we have decided on our feature, we can come up with several buckets, each of which shares a set of feature values. Table 2 lists three examples of the possible buckets.
| Body ratio | Number of fins | Color | |
| Bucket A | 0.5 - 0.33 | 3 | Red |
| Bucket B | 0.25 - 0.20 | 4 | Brown |
| Bucket C | 0.20 - 0.16 | 7 | Green |
(Table 2 - Three arbitrary buckets and their features)
Ideally, the buckets and their properties come from observation, meaning that you can create completely different sets of buckets if your observation is different. You might consider a specific combination of features impossible. That is probably because that combination has never happened in the data series. If later we see a fish having those properties together, we should either remove it from the data as an outlier (due to mutation, or erroneous data for example), or add a new bucket.
Now that we have the buckets, let’s see if we can categorize an imaginary type of fish into one of the buckets. Assume the fish has a body ratio of 0.44, has three fins, and is red. According to Table 2, we can say that it belongs to the bucket A.
Example
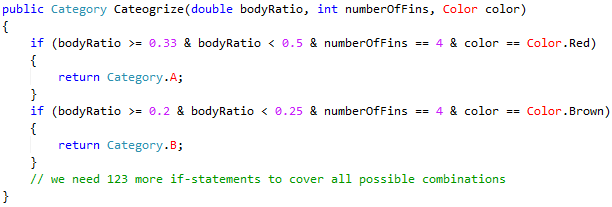
In this example, the total number of possible feature-interval combinations is 5x5x5=125 which means we must write 125 if-statements to cover all the cases like the following (in C#):

Not terrible, right? But to make things slightly more realistic, assume we have forty features each of which have on average ten intervals. Then the total number of combinations could be as high as 1040
You can easily spot the issue here. We have to tackle problems like this differently.
Well, take sales prediction as an example. It is more or less the same problem. There are hundreds of factors affecting a company’s sales such as advertisements in various channels, competitors and their activities, campaigns, pricing strategies, etc. and each of them can take many values. The goal is to predict sales which could basically mean classifying it into ten buckets: the first one being poor and the last one being excellent. Customer segmentation can also be seen as a classification problem. You want to categorize your customers into three classes of green, yellow, and red. Green means they are satisfied with your service and it is unlikely they terminate their contract anytime soon. Yellow represents the customers that are not fully satisfied and red customers who are very close to quit. Based on such analysis you will be able to minimize your churn rate.
In the next article we will explore some data processing techniques.
